Food prices and measuring inflation

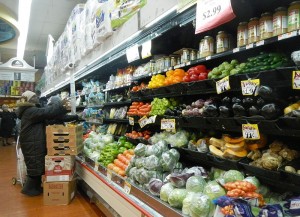
Produce section in East Harlem grocery store. Image by Jim.henderson, Cretive Commons
Inflation rate seem relatively low right now. The current number for Canada runs around 2.11%. In the U.S. it’s about 1.7%.
Sounds very modest right?
I am frequently skeptical. What about gas? What about food? Don’t statisticians drive and eat?!
Well, sometimes food and gas are excluded from those formulas, for reasons we’ll explore in a moment.
My own anecdotal experience is that food costs are most certainly exceeding the standard rate of inflation. Price jumps are an obvious example. And don’t forget the stealth model, as in smaller or deceptive packaging. Here’s more on that from the Boston Globe:
Many years ago, dear children, a 1-pound can of coffee contained 1 pound of coffee. Today, that can probably holds something like 11 ounces. A pound of hot dogs? At least one brand is down to 14 ounces. A ½-gallon of ice cream? Gone the way of the dodo, replaced by the 1½-quart container. A bag of sugar, weighing 5 pounds since time immemorial, is now 4 pounds.
As anyone who has set foot in a supermarket in the past couple of years can tell you, food prices are up — way up. To some extent, food manufacturers are facing the same challenges as consumers: Raw materials are more expensive, transportation costs higher, resources scarcer. “The reality is,” says Phil Lempert, editor of SupermarketGuru.com, “if you look at USDA projections, food is going to get more expensive. And as a result, food companies are going to do one of two or three things: Raise prices and keep packages the same, or reduce the quantity in the package. Or do a little of both.”
Higher food prices disproportionally hurt those living on low or fixed incomes. (At the same time, who doesn’t want farmers to make a decent living? It’s a quandary!)
At least one current study of food prices found sharply higher prices, as reported by Don Butler for the Ottawa Citizen:
The cost of a nutritious diet in Ottawa jumped by a stunning 10 per cent over the past year — about five times the rate of inflation and the largest increase in at least a decade.
According to Ottawa Public Health’s annual Nutritious Food Basket Survey, released Wednesday, it now costs a minimum of $869 every month to adequately feed a family of four in Ottawa. That’s an increase of $80 a month since 2013.
According coverage on the same topic from the Ottawa Sun:
“We’ve seen year-over-year increases in the range of 4% or 5%, but we haven’t seen it jump 10% in a very long time,” said Sherry Nigro, OPH manager of health promotion and disease prevention.
To be fair, that’s just one number, from one study, in one Canadian city.
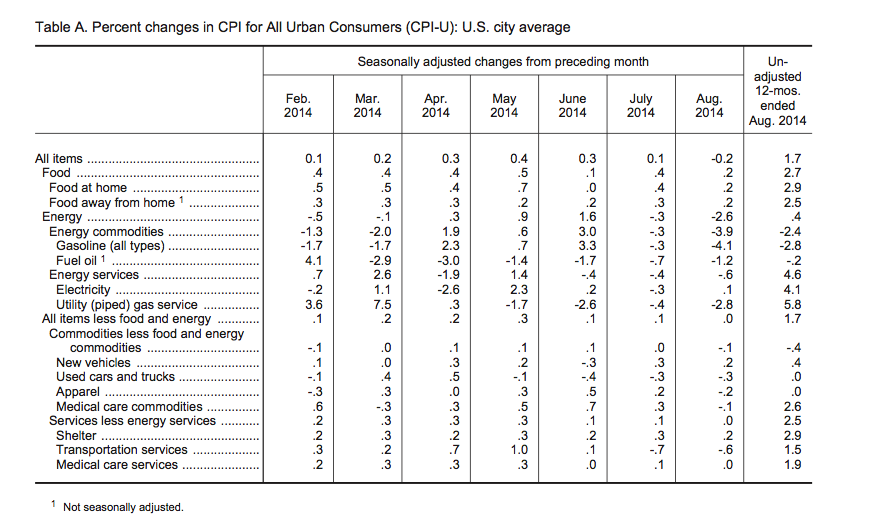
What’s the story for Canada as a whole? And for U.S. food prices? Again, the overall stats do not seem very alarming. Food inflation may run higher than annual inflation scores, but remains under 3% for both countries at present.
Inflation can be measured in different ways, including something called the Consumer Price Index (CPI) and another measure called Personal Consumption Expenditures (PCE) produced by the Department of Commerce.
The Federal Reserve Board talks about both at this webpage, and addresses the issue of excluding for volatility:
- Finally, policymakers examine a variety of “core” inflation measures to help identify inflation trends. The most common type of core inflation measures excludes items that tend to go up and down in price dramatically or often, like food and energy items. For those items, a large price change in one period does not necessarily tend to be followed by another large change in the same direction in the following period. Although food and energy make up an important part of the budget for most households–and policymakers ultimately seek to stabilize overall consumer prices–core inflation measures that leave out items with volatile prices can be useful in assessing inflation trends.
Doug Short blogged in September about “Two Measures of Inflation and Fed Policy” with a number of over-lay charts showing how the two measures track over time:
This close-up comparison gives us clues as to why the Federal Reserve prefers Core PCE over Core CPI as an indicator of its success in managing inflation: Core PCE is considerably less volatile than CPI. Given the Fed’s twin mandates of price stability and maximizing employment, it’s not surprising that in the past the less volatile Core PCE has been their metric of choice.
Have your eyes glazed over yet? Assessing statistical models and their relative merits is for smarter people than me. And it’s true, price increases get our notice. Prices that remain steady or drop generate less attention.
But how does buying food feel to you right now? If your monthly food bill has gone up, is that coming in at the 2% range, the 10% range – or something completely different?


I’ve never understood the exclusion of food and energy prices from inflation figures. Yes, they go up and down more rapidly than say, housing or automobiles but we buy food and energy on a regular basis. We don’t buy houses or cars on a regular basis or any other commodity for that matter. Food and fuel (along with health care) are not hings we can put off until the price drops. When we need them, we need them now. And in my experience when food prices go down it is rarely all the way back to the prior level. Instead they do that trick of selling it in smaller units so it looks like it has dropped back to the former level but really hasn’t.
You asked if I feel like food is more expensive now? Yes, absolutely.
I think excluding food and energy is all about not increasing social security monthly payments.
The Fed wants to create the illusion that prices aren’t going up so they can continue to give almost free loans to banks and others who don’ need free loans.
Protect the rich, not the poor is the Fed plan.